I followed instructions provided by Esri to study the relationship between alcohol and violent crime.
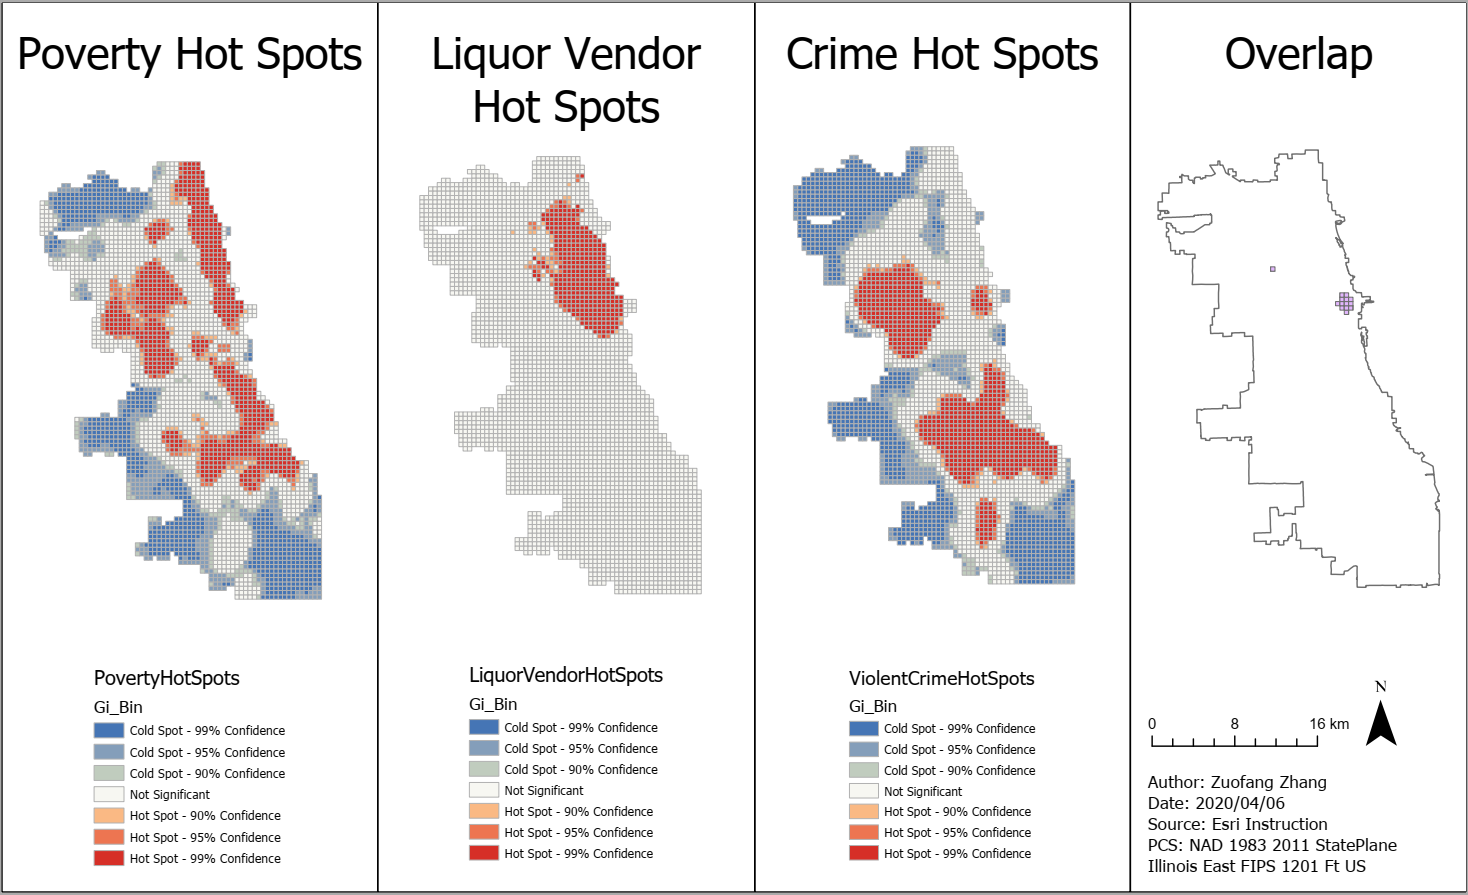
This analysis used violent crime data in Chicago to study the actual correlation between crime events and liquor establishments. The types of crimes included homicides, rape, robbery, aggravated assault, and aggravated battery incidents. Both crime and liquor business data were point data which made it hard to examine the spatial pattern. Using the hot spot analysis tool, we identified crime and liquor business hot spots individually. Hot spots referred to locations with high density of crime incidences or liquor sellers. There was overlap between crime and liquor business hot spots which proved that these two activities may spatially correspond with each other. According to the social disorganization theory, neighborhoods with less stable residential population and lower income may be more vulnerable to crimes. Therefore, understanding the spatial distribution of poverty may help us locate the most vulnerable place within the overlapping areas. After overlaying the three hot spot maps (i.e., crime events, existing liquor establishments, and poverty), only two neighborhoods were identified where statistically significant hot spots were overlapped, by which it means that no strong correlation between liquor business and crime events was found outside the small overlapping areas (Fig.1).
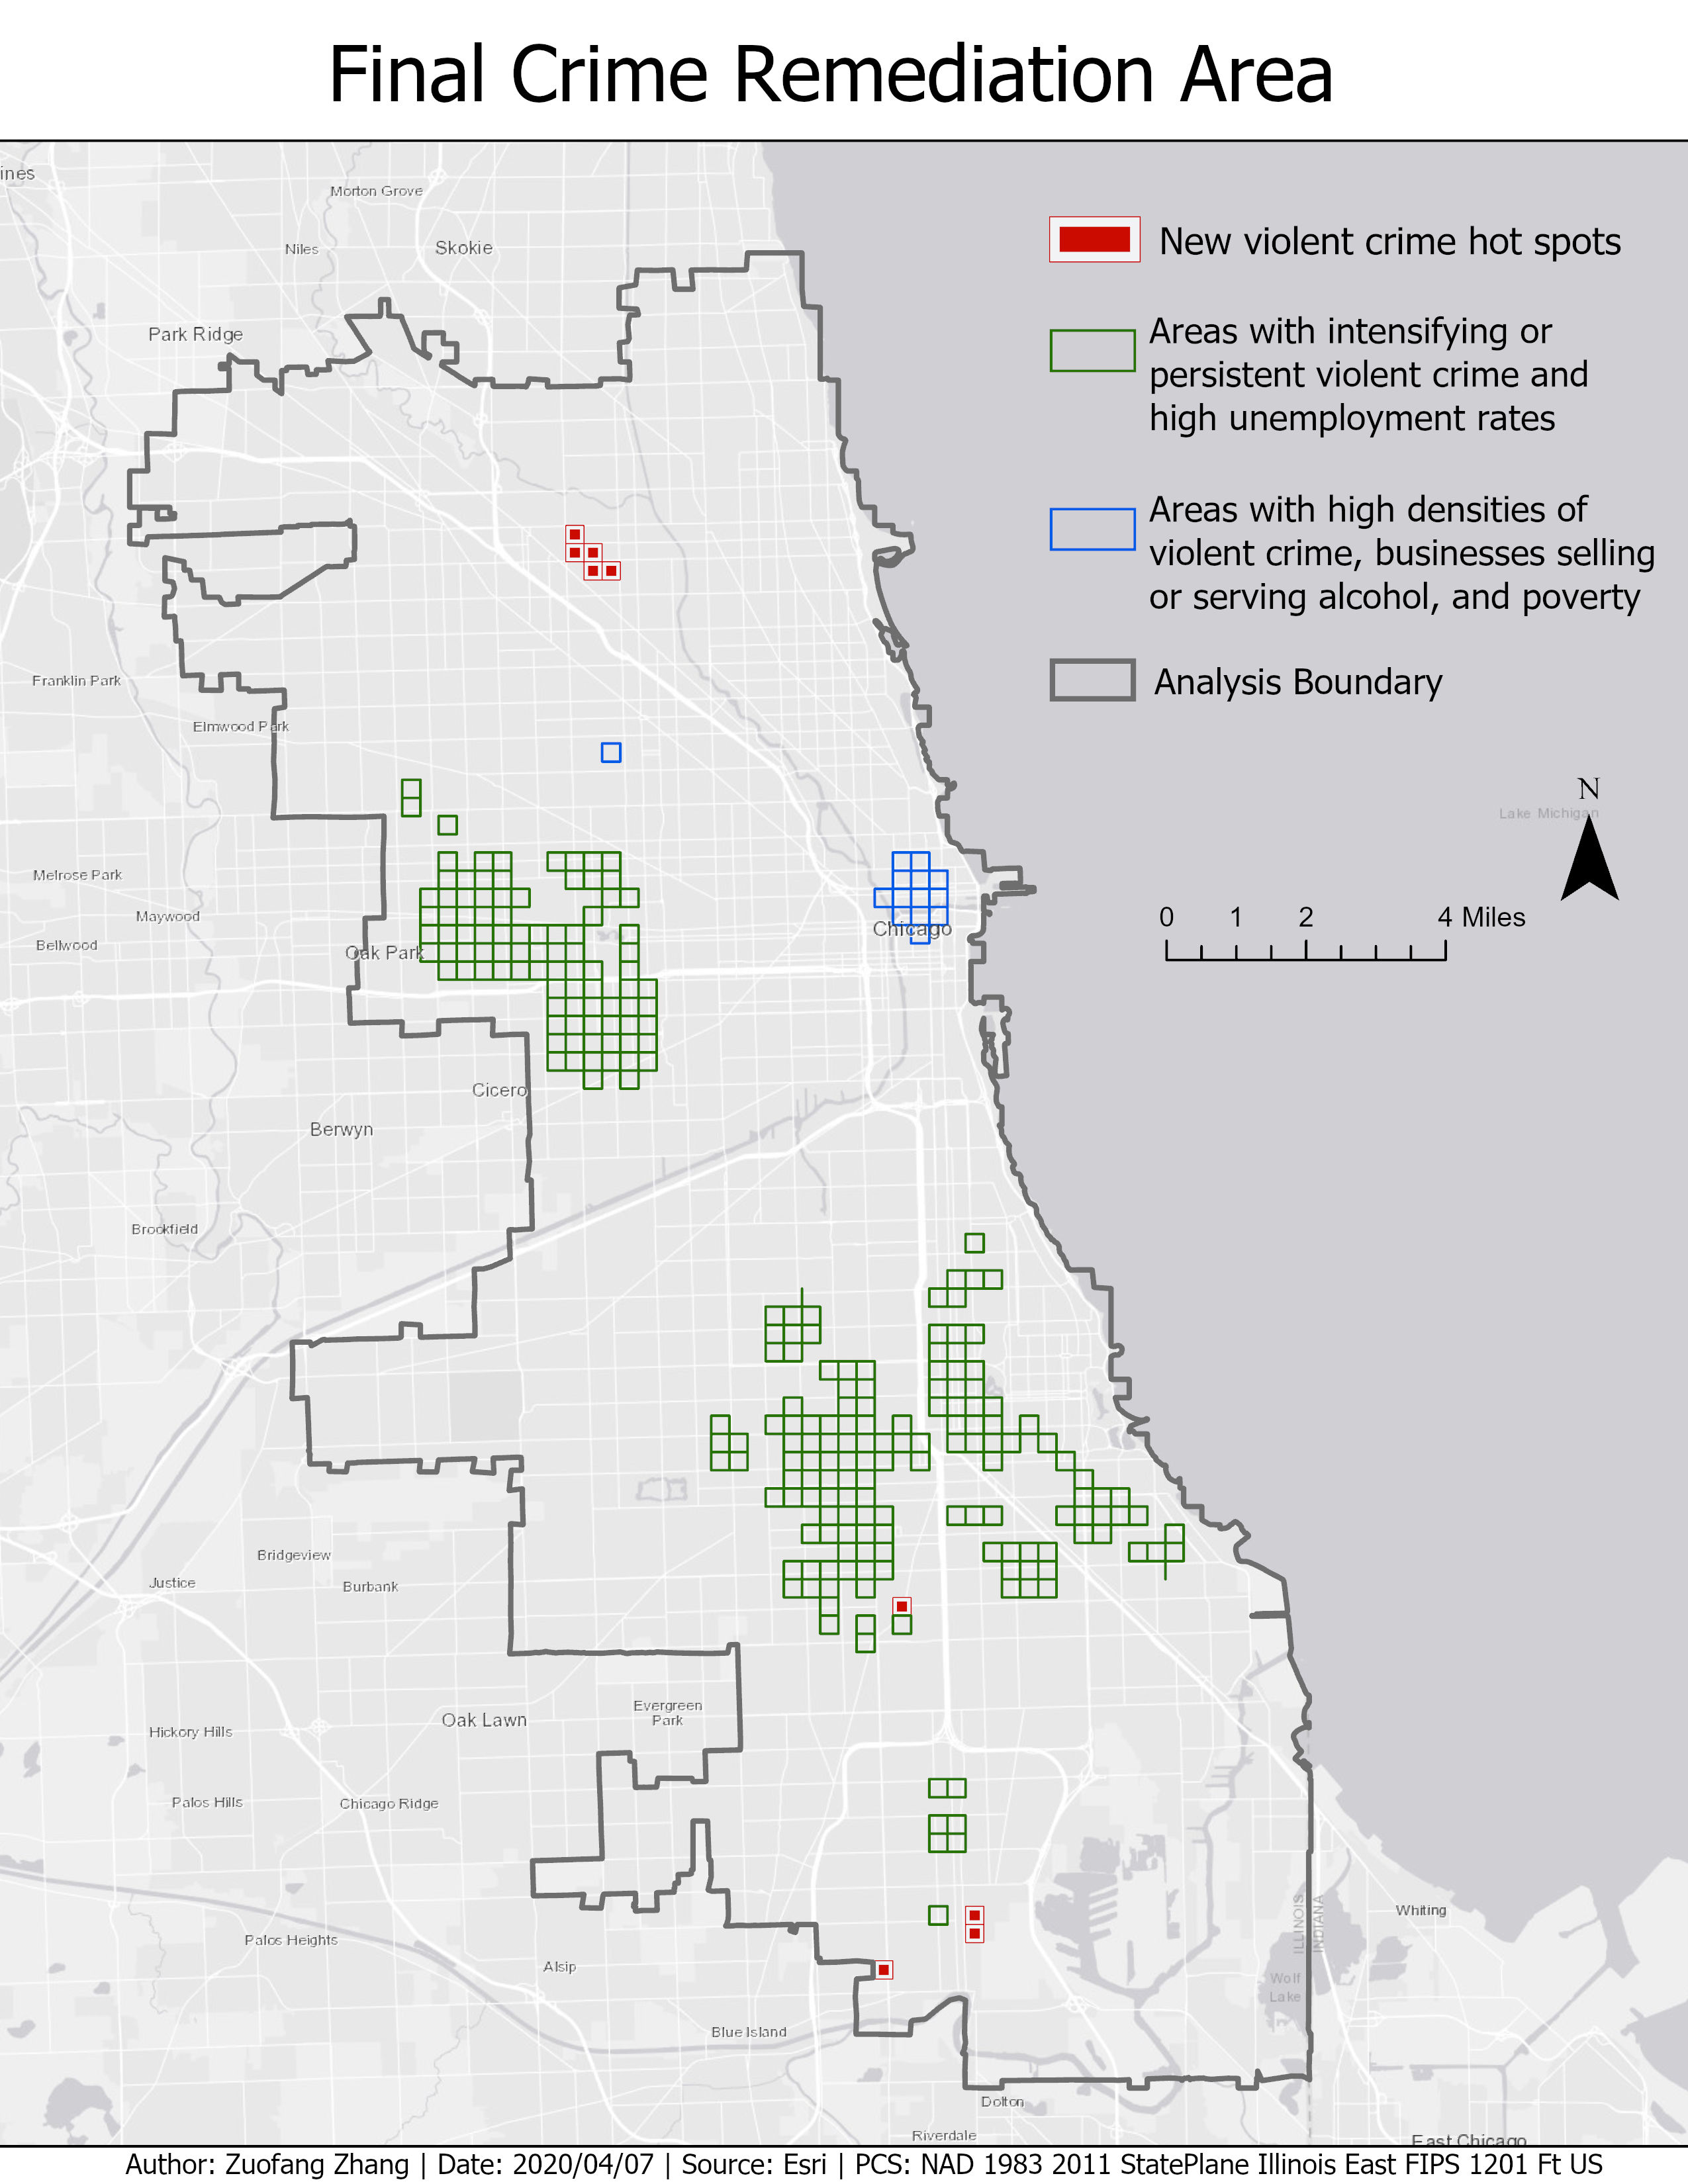
To study the violent crime in further detail, the Space-time pattern mining tool was used to analyze the trend of crime hot spots over time. Among different types of crime hot spots, intensifying, persistent, and consecutive hot spots indicated that these locations had statistically significant intense crime activity over most of or the most recent time periods. However, these persistent or intensifying crime hot spots were not overlapped with the most vulnerable places identified in the above step. As a result, violent crime was not strongly associated with liquor business or poverty.
The hot spot analysis result of unemployment rate showed that there was a stronger spatial correlation between unemployment and violent crime because more overlapping areas can be found (Fig.2). Most of neighborhoods with high unemployment rates were overlapped with intensifying, persistent, and consecutive crime hot spots.