I followed the tutorial provided by Esri to study the spatial distribution of Dengue Fever.
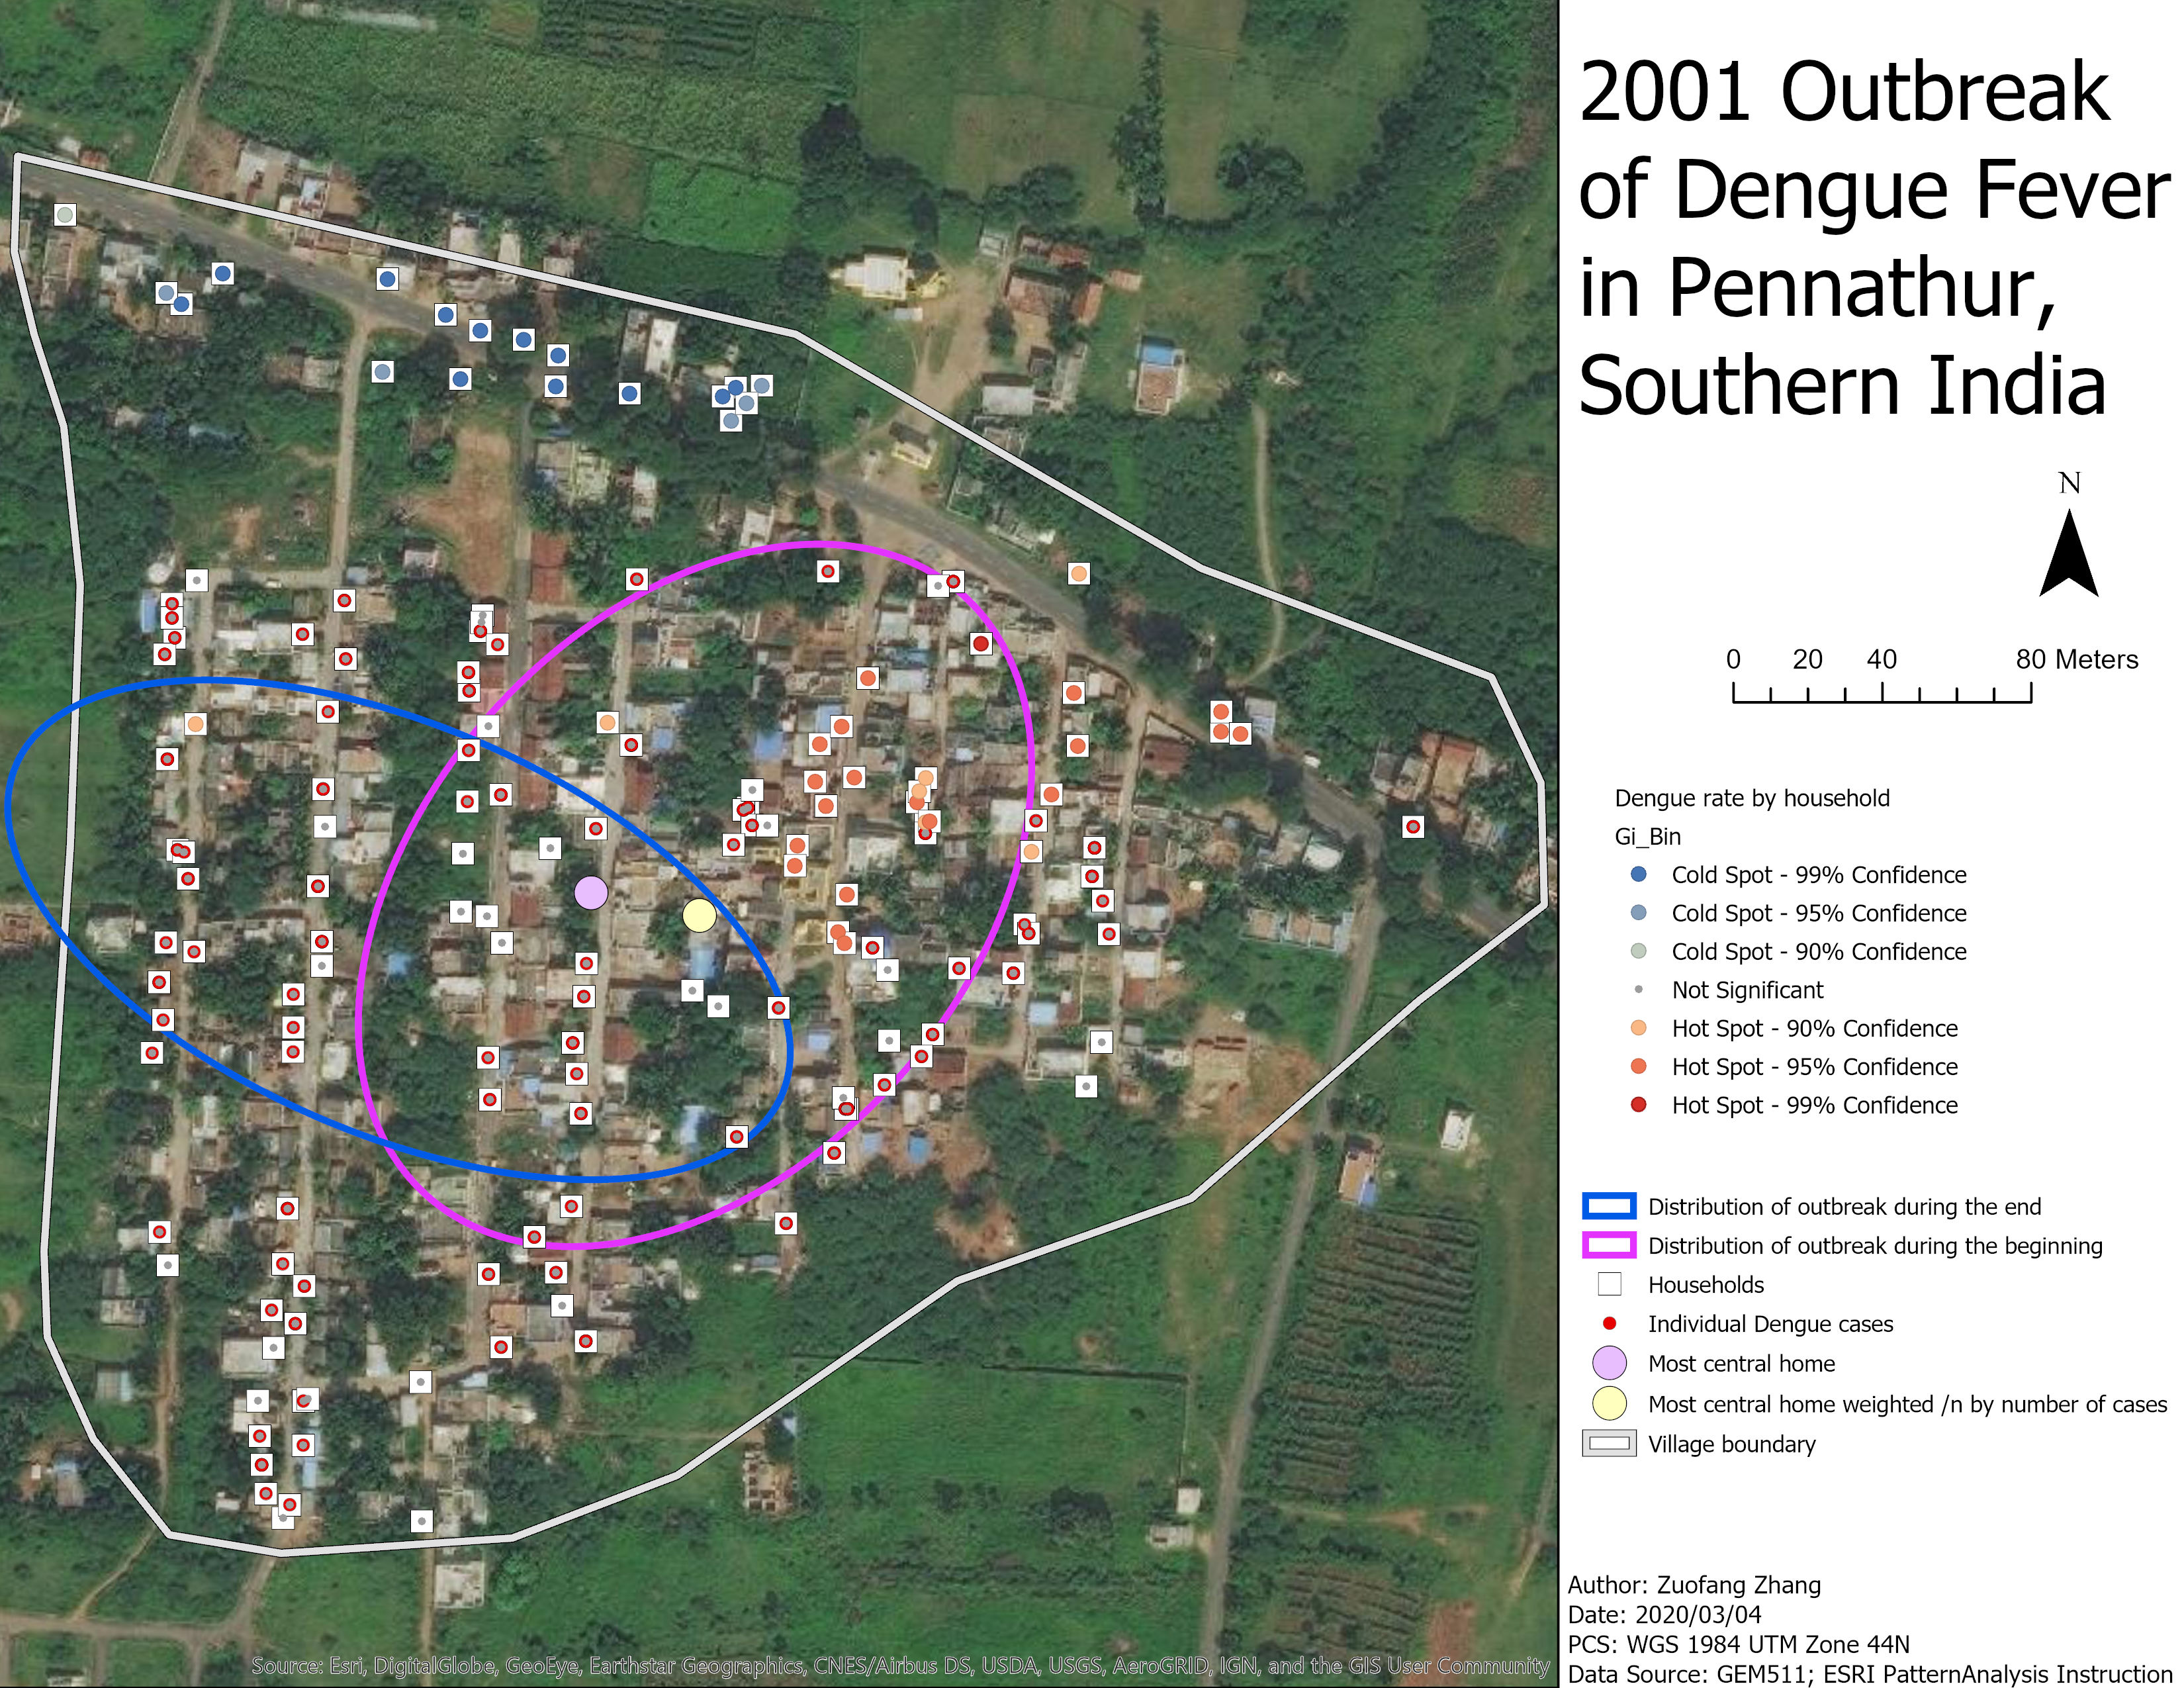
The size of the ellipse showing the distribution of the Dengue fever outbreak during the beginning of the 35-day period (i.e., August 1st) was larger than the ellipse corresponding to the outbreak during the end of the period (i.e., September 4th & 5th). The size of the ellipse of the first week (i.e., August 1st, 2nd, 3rd, & 5th) was even larger. The ellipse of the first day had longer semi-minor axes than that of the last week, while the semi-major axes of the two ellipses were of similar length. The two ellipses centered on the mean center for all dengue cases that happened during the time. The orientations of the two ellipses were different. The semi-major axes of the ellipse during the beginning spread from southwestern to northeastern, while the ellipse of the last week spread from northwestern to southeastern.
The ellipses showed the distribution of individual Dengue cases and whether it had a specific orientation of dispersion. The different sizes of the two ellipses indicated that the spread of the disease changed through time. The size of the ellipse decreased from the beginning to the end of the period showed that the disease may have been controlled within a smaller area.
The center of the ellipse also moved to the west as well as the orientation changed from southwestern-northeastern to northwestern-southeastern. Since the Dengue fever is transmitted by mosquitos, the change of the orientation may be related to the movement of mosquitos. Based on the hot spot analysis, the highest proportions of Dengue infection referred to the hottest spots were clustered in the eastern part of the village. The ellipse during the beginning overlapped with most of the hot spots of 95% confidence, while the ellipse during the end covered hot spots of less confidence. This may indicate that the infection rate decreased as the disease spread. This may because people around have taken actions to overcome the disease.
The most central household weighted by the number of cases was to the east of the most geographically central household. This may indicate that most of the households with higher proportions of Dengue infection clustered in the eastern part of the village.